Business Dynamics in Canada - 2022 Overview
A stable macroeconomic environment, low corruption, sound banking system and a skilled, digitally-adept labour force and proximity to the US market are among the key advantages of Canada’s business environment. Canada also has solid road, cargo and trade infrastructure, with further investments being planned for the forecast period. Nevertheless, relatively high taxes and costly labour force provide substantial challenges for new businesses in the country.
HEADLINES
Canada ranked ninth in the Index of Economic Freedom ranking 2021, performing best in the Financial Freedom and Trade Freedom pillars
In 2021, the country reported 19.3 commercial bank branches per 100,000 adults, lower than the regional average
As of 2021, the central bank policy rate in Canada stood at 0.2%, higher than the regional average of 0.1%, facilitating effective access to financing for businesses
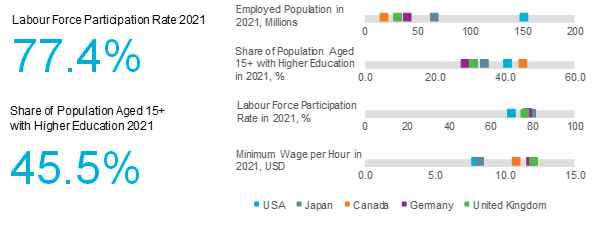
45.5% of Canada’s population aged 15+ had higher education in 2021, while the labour force participation rate stood at 77.3% of the working-age population in 2021
The country ranks 22nd globally in the Logistics Performance Index 2021, recording the best performance in the Timeliness of International Shipments and Quality of Logistics Services pillars
Canada ranked 11th in the Network Readiness Index ranking 2021 pointing to high potential for business innovations
OPERATIONAL AND REGULATORY ENVIRONMENT
Despite decline in the Economic Freedom ranking, Canada remains an attractive location to operate a business
Canada stood ninth out of 186 countries globally in the Index of Economic Freedom ranking 2021, illustrating its ongoing attractiveness as a location to operate a business in. The country has recorded the best performance in the Financial Freedom and Trade Freedom pillars. High banking efficiency and independence from government control and interference in the financial sector facilitates businesses’ access to financing in a free market. The country has strong judicial effectiveness, governmental integrity and low corruption levels, adding to the country’s attractiveness for both domestic and foreign investors. Meanwhile, absence of tariff and non-tariff barriers that affect imports and exports of goods and services in the country creates an attractive business environment, particularly for trade-orientated companies, or those reliant on imported materials. Nevertheless, the operational environment in Canada has worsened over recent years. The Tax Burden ranking for Canada has shown decline from 83rd position in 2015 to 109th in 2021, suggesting increasing top marginal tax rate on corporate income, and the total tax burden. Meanwhile, the Business Freedom ranking also worsened during the historic period, falling from 14th position in 2015 to 24th in 2021, pointing to worsening efficiency of starting, operating and closing a business in Canada.
FINANCING AND INVESTMENT
Canada revises foreign investment guidelines in 2021
Canada ranked 18th globally in the Investment Freedom pillar in 2021 (as compared to 21st position the year before), pointing to low constraints on the flow of investment capital. Furthermore, investors are attracted by significant market capitalisation, high availability of domestic credit to the private sector and a sound banking system. Proximity to the US consumer market is another major attraction point. Nevertheless, the country still experiences a decrease in FDI due to the COVID-19-caused economic disruptions. Meanwhile, Canadian government has announced revised foreign investment screening guidelines in March 2021, including additional security considerations in sensitive technology areas, critical mineral industries and sensitive personal data. Furthermore, lack of regulatory clarity to attract high-quality FDI remains in key areas such as artificial intelligence, digital health and fintech.
The central bank policy rate in 2021 remained low at 0.2%, providing favourable lending conditions in the country. Furthermore, the annual lending rate in Canada stood at 2.7% in 2021, lower than in regional peers. Finally, as a developed country, Canada continued to close the gap on unbanked population, which contracted from 3.3% of population aged 15+ in 2015 to 2.7% in 2021.
SKILLS AND LABOUR
Despite having one of the most educated labour markets, Canada still experiences labour shortages in high-growth technology sectors
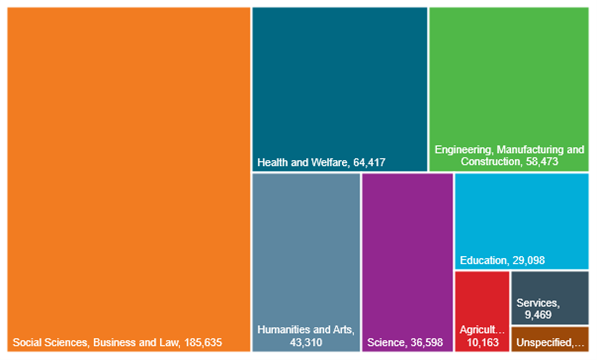
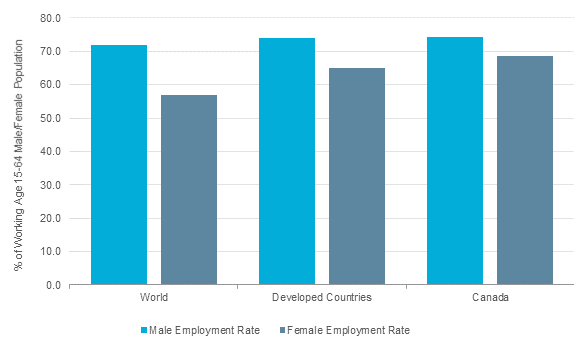
Canada’s ranking in the Labour pillar in the Index of Economic Freedom has improved from 37th position in 2015 to 36th in 2021. The country boasts a highly skilled labour force, having one of the highest shares of population with higher education in 2021 and relatively contained gender gap. To illustrate, as of 2021, 45.5% of Canada’s population aged 15+ had higher education, and 68.4% of the working-age female population was active in the labour market, as compared to a male employment rate of 74.3%. Social Sciences, Business and Law are the most popular higher education programmes in Canada, accounting for 42.0% of total graduates in 2021, the share significantly higher than the developed countries’ average of 31.6%. The large pool of educated professionals provides solid support for business development in the country. Nevertheless, skilled labour shortages remain in key high-growth sectors, such as technology, cleantech, digital health, fintech and advanced manufacturing. Furthermore, the inflow of highly-qualified expatriates to fill gaps in the domestic labour market experiences disruptions caused by COVID-19-related restrictions.
TRANSPORT AND INFRASTRUCTURE
Canada offers developed trade infrastructure
Canada ranks 22nd out of 152 countries globally in the Logistics Performance Index 2021, coming down from 13th position in 2015. Ease of Arranging International Shipments pillar was the worst-performing category in Canada’s Logistics Performance Index in 2021. Nevertheless, exports are an important part of Canada’s GDP, the country largely benefiting from proximity to the US and existing infrastructure to sustain trade flow into the neighbouring country. Furthermore, even though logistics services in the country continue to be aggravated by large distances between population centres and climate factors during particularly cold winters, Canada’s Trade Freedom ranking has improved from ninth position in 2015 to fourth in 2021, illustrating a favourable environment for export businesses. Excellent road and airport connectivity remain the key strengths in the country’s infrastructure. In addition, Railway Freight Traffic has expanded in 2021 despite the COVID-19 outbreak; over 2015-2021 Canada’s Railway Freight Traffic has increased by 3.5% to 426 billion tonne-kilometres. The government also directed sizeable funds to improve the country’s infrastructure in 2020 and 2021, further advancing the competitive edge with improvement in transportation and logistics. For example, in 2021 the government approved funding of CAD14.9 billion for public transit projects over the upcoming eight years.
DIGITALISATION AND INNOVATION
High digitalisation provides market opportunities for e-commerce expansion
Canada ranked 11th out of 130 countries globally in the Network Readiness Index (NRI) 2021. The country recorded the best performance in the Governance and Technology pillars of the NRI, ranking sixth and ninth, respectively. The country also has high innovation capacity, thanks to its high workforce diversity, numerous scientific publications, and substantial research institution prominence in the country. R&D investments in Canada accounted for 1.5% of GDP in 2021, with business Enterprise Funds being the leading investors, accounting for 41.8% of the country’s total expenditure on R&D. Meanwhile, e-commerce markets are benefiting from Canada’s tech-savviness and high digitalisation. The household access to internet is nearly universal at 95.2% in 2021, while 74.3% of businesses are placing orders online and 33.0% of the population was using the internet for selling goods and services. Nevertheless, the share of Canadian businesses receiving orders over the internet remains modest, illustrating future expansion opportunities for online retail.
OPERATIONAL AND LEGAL ENVIRONMENT
Chart 1 Operational and Legal Environment Key Indicators
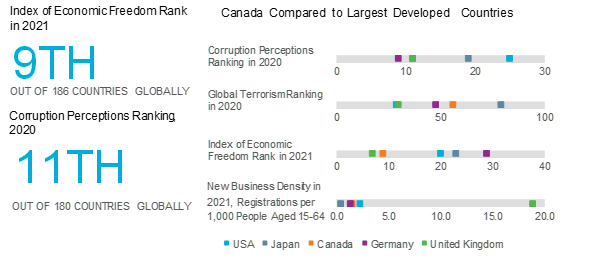
Source: Euromonitor International from The Heritage Foundation, Transparency International, World Bank, Institute for Economics and Peace
Note: Index of Economic Freedom ranks a country out of 186; Corruption Perceptions Index ranks 180 countries with the worst-performing country ranked at the bottom, Global Terrorism Index ranks 162 countries with the highest risk country ranked first.
Chart 2 Index of Economic Freedom Ranking by Pillar in Canada and Regional Comparison 2021
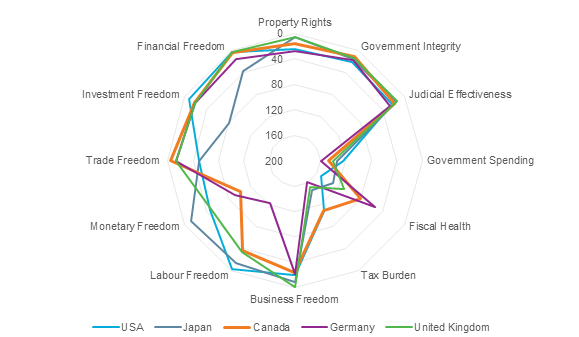
Source: Euromonitor International from The Heritage Foundation.
Note: The Index of Economic Freedom ranks a country out of 186 economies, see Appendix A.
Chart 3 Index of Economic Freedom Ranking 2016-2021
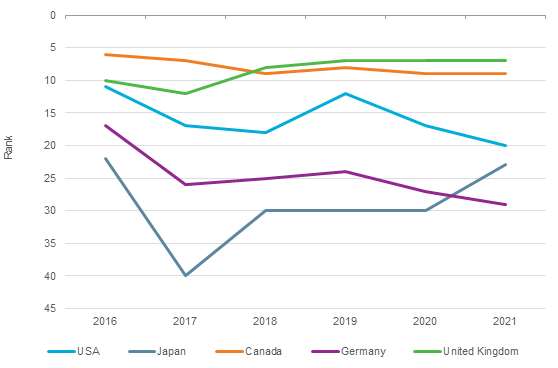
Source: Euromonitor International from The Heritage Foundation
Note: The Index of Economic Freedom ranks a country out of 186 economies, see Appendix A.
Chart 4 Index of Economic Freedom: Judicial Effectiveness Pillar Rank in Canada and Regional Comparison 2017-2021
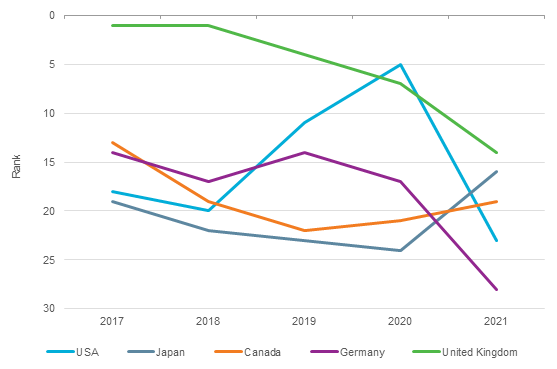
Source: Euromonitor International from The Heritage Foundation
Note: Judicial Effectiveness Pillar (The Index of Economic Freedom) measures judicial independence, quality of the judicial process, and, favouritism in decisions of government officials, ranks a country out of 186 economies, see Appendix A.
Chart 5 Index of Economic Freedom: Government Integrity Pillar Rank in Canada and Regional Comparison 2016-2021
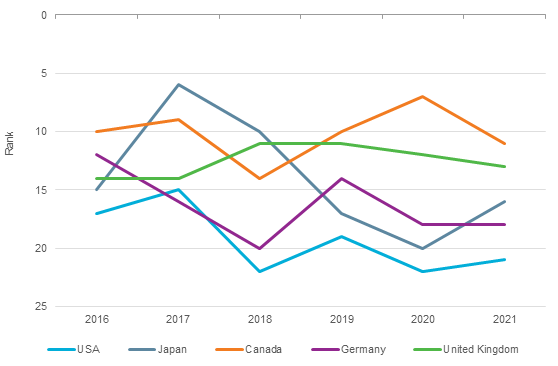
Source: Euromonitor International from The Heritage Foundation
Note: Government Integrity Pillar (The Index of Economic Freedom) measures public trust in politicians, irregular payments and bribes, transparency of government policy making, etc, ranks a country out of 186 economies, see Appendix A.
Chart 6 Corruption Perceptions Ranking: Canada and Regional Comparison 2015-2020
Source: Euromonitor International from Transparency International
Note: Corruption Perceptions Index ranks 180 countries with the worst-performing country ranked at the bottom.
FINANCING AND INVESTMENTS
Chart 7 Key Financial and Investment Indicators

Source: Euromonitor International from International Monetary Fund (IMF), International Financial Statistics
Note: Commercial Bank Availability measures branches per 100,000 adults.
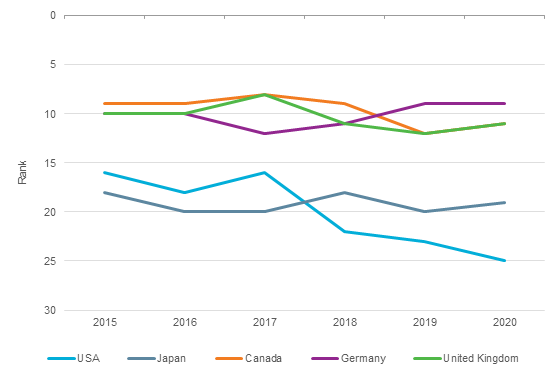
Chart 8 Index of Economic Freedom: Property Rights Pillar Rank in Canada and Regional Comparison 2016-2021

Source: Euromonitor International from The Heritage Foundation
Note: Property Rights Pillar (The Index of Economic Freedom) measures the property rights component that assesses the extent to which a country’s legal framework allows individuals to acquire, hold, and utilise private property, secured by clear laws that the government enforces effectively in 186 countries globally, see Appendix A.
Chart 9 Bank Nonperforming Loans to Total Gross Loans 2016-2021
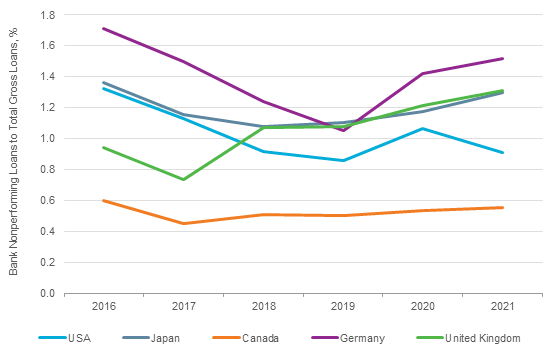
Source: Euromonitor International from World Bank
SKILLS AND LABOUR
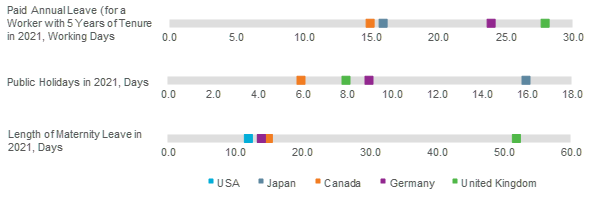
Chart 10 Key Skills and Labour Indicators
Source: Euromonitor International from UNESCO/national statistics/UN, International Labour Organization (ILO), UNDP, Euromonitor International from World Economic Forum
Chart 11 Population Aged 15+ with Higher Education 2016-2021

Source: Euromonitor International from UNESCO/Eurostat/OECD/national statistics
Chart 13 Number of University Graduates by Programme 2021
Source: Euromonitor International from national s tatistics/Eurostat/UNESCO/OECD
Chart 14 Employment by Age 2021
Source: Euromonitor International from International Labour Organization (ILO)/Eurostat/national statistics
Chart 15 Employment by Gender 2021
Source: Euromonitor International from International Labour Organization (ILO)/Eurostat/national statistics
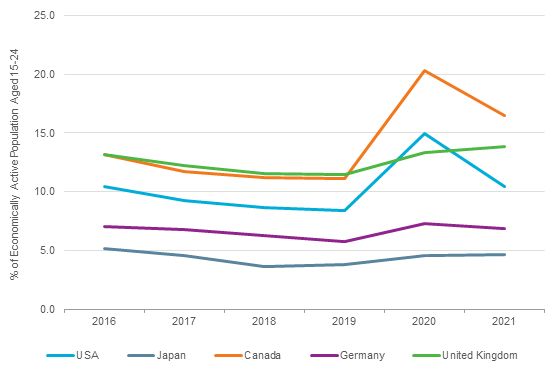
Chart 16 Youth Unemployment Rate 2016-2021
Source: Euromonitor International from International Labour Organization (ILO)/Eurostat/national statistics
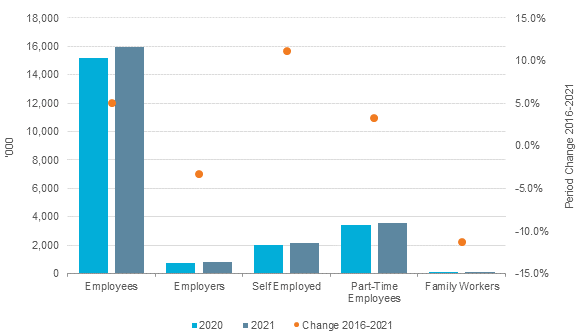
Chart 17 Labour Structure Change 2016-2021
Source: Euromonitor International from International Labour Organization (ILO)/Eurostat/national statistics
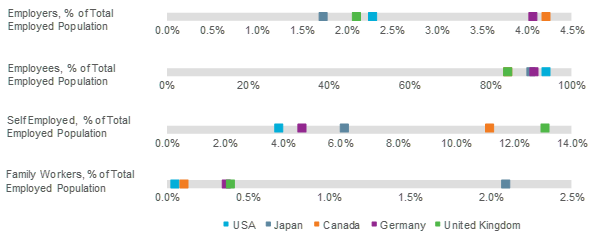
Chart 18 Labour Structure Comparison 2021
Source: Euromonitor International from International Labour Organization (ILO)/Eurostat/national statistics
Chart 19 Self Employed as % of Total Employed Population 2021

Source: Euromonitor International from International Labour Organization (ILO)/Eurostat/national statistics
Chart 20 Index of Economic Freedom: Labour Pillar Rank in Canada and Regional Comparison 2016-2021

Source: Euromonitor International from The Heritage Foundation
Note: Labour Pillar (The Index of Economic Freedom) measures various aspects of the legal and regulatory framework of a country’s labour market, including regulations concerning minimum wages, laws inhibiting layoffs among 186 countries globally, see Appendix A.
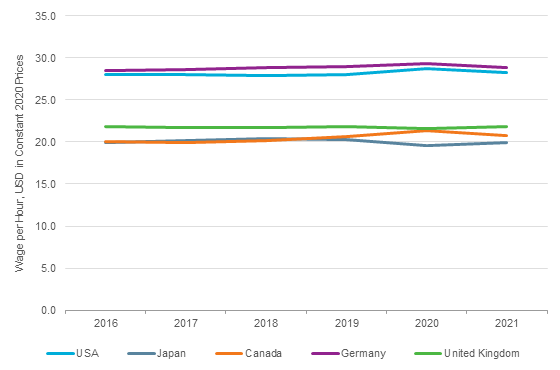
Chart 21 Wage per Hour in Manufacturing Sector 2016-2021
Source: Euromonitor International from International Labour Organization (ILO)/Eurostat/national statistics
Chart 22 Labour Market Regulations in Canada and Regional Comparison 2021
Source: Euromonitor International from World Bank/International Labour Organization (ILO)/UN
TRANSPORT AND INFRASTRUCTURE
Chart 23 Key Infrastructure Indicators

Source: Euromonitor International from International Road Federation (IRF)/International Union of Railways (IUC)/UN/Eurostat/national statistics/World Bank
Note: Logistics Performance Index ranks 152 countries globally, Freight traffic volume measured in million tonne-kilometres.
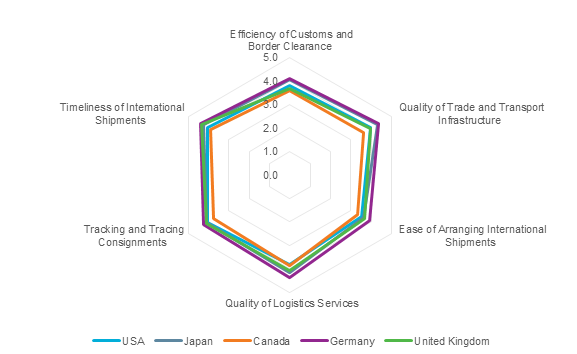
Chart 24 Logistics Performance Index Scores by Pillar in Canada and Regional Comparison 2021
Source: Euromonitor International from World Bank
Note: Logistics Performance Index ranks 152 countries globally with scores from 1 (low) to 5 (high), see Appendix B.
Chart 25 Logistics Performance Index Ranking for Canada and Regional Comparison 2016-2021

Source: Euromonitor International from World Bank
Note: Logistics Performance Index ranks 152 countries globally.
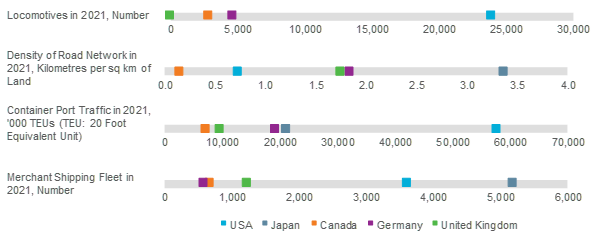
Chart 26 Transportation Mode Indicators in Canada and Regional Comparison
Source: Euromonitor International from International Road Federation (IRF)/International Union of Railways (IUC)/ Eurostat/national statistics/UNCTAD
Chart 27 Road Infrastructure 2021

Source: Euromonitor International from International Road Federation (IRF)/Eurostat/national statistics
DIGITALISATION AND INNOVATION
Chart 28 Innovation and Digitalisation Key Indicators

Source: Euromonitor International from Portulans Institute/UNESCO/Eurostat/UNCTAD/International Telecommunications Union/national statistics
Note: Network Readiness Index 2020 ranks a total of 130 economies, for more see Appendix C.
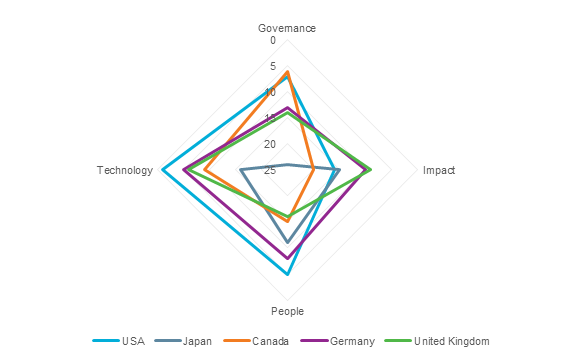
Chart 29 Network Readiness Ranking by Pillar in Canada and Regional Comparison 2021
Source: Euromonitor International from Portulans Institute
Note: Network Readiness ranks a total of 130 economies, see Appendix C.
Chart 30 Network Readiness Ranking for Canada and Regional Comparison 2019-2021

Source: Euromonitor International from Portulans Institute
Note: Network Readiness ranks a total of 130 economies, see Appendix C.
Chart 31 Network Readiness Ranking: Technology Pillar for Canada and Regional Comparison 2019-2021

Source: Euromonitor International from Portulans Institute
Note: Technology Pillar (Network Readiness Ranking) measures the level of technology that is a sine qua non for a country’s participation in the global economy out of 130 economies, see Appendix C.
Chart 32 Intellectual Property: Canada Compared to Selected Regional Peers 2021

Source: Euromonitor International from World Intellectual Property Organization (WIPO)/OECD/USPTO/EPO
APPENDIX
Index of Economic Freedom 2021
The 2021 Index of Economic Freedom is based on 10 quantitative and qualitative factors, grouped into four broad categories of economic freedom: Each of the 10 economic freedoms (referred to as pillars in this report) within these categories is graded on a scale of 0 to 100, where a higher score shows better economic freedom.
Property Rights Ranking - The property rights component is an assessment of the ability of individuals to accumulate private property, secured by clear laws that are fully enforced by the state. It measures the degree to which a country’s laws protect private property rights and the degree to which its government enforces those laws. It also assesses the likelihood that private property will be expropriated and analyses the independence of the judiciary, the existence of corruption within the judiciary, and the ability of individuals and businesses to enforce contracts.
Government Integrity Ranking for this component is derived primarily from Transparency International’s Corruption Perceptions Index (CPI) for 2011, which measures the level of corruption in 180 countries. Ranking is obtained from the index reflecting better score in a higher position.
Judicial Effectiveness Ranking - Judicial effectiveness requires efficient and fair judicial systems to ensure that laws are fully respected, with appropriate legal actions taken against violations. The score is derived from judicial independence, quality of the judicial process and likelihood of obtaining favourable judicial decisions.
Government Spending Ranking - This component considers the level of government expenditure as a percentage of GDP. The ideal level will vary from country to country, depending on factors ranging from culture to geography to level of development.
Fiscal Health Ranking - Widening deficits and a growing debt burden, both of which are caused by poor government budget management, lead to the erosion of a country’s overall fiscal health. Deteriorating fiscal health, in turn, is associated with macroeconomic instability and economic uncertainty.
Tax Burden Ranking - Fiscal freedom is a measure of the tax burden imposed by government. It includes direct taxes, in terms of the top marginal tax rates on individual and corporate incomes, and overall taxes, including all forms of direct and indirect taxation at all levels of government, as a percentage of GDP. Thus, the fiscal freedom component is composed of the top marginal tax rate on individual income, the top marginal tax rate on corporate income, and the total tax burden as a percentage of GDP.
Business Freedom Ranking is an overall indicator of the efficiency of government regulation of business. The quantitative score is derived from an array of measurements of the difficulty of starting, operating, and closing a business.
Labour Freedom Ranking is a quantitative measure that considers various aspects of the legal and regulatory framework of a country’s labour market, including regulations concerning minimum wages, laws inhibiting layoffs, severance requirements, and measurable regulatory constraints on hiring and hours worked.
Monetary Freedom Ranking combines a measure of price stability with an assessment of price controls. Both inflation and price controls distort market activity. Price stability without microeconomic intervention is the ideal state for the free market.
Trade Freedom Ranking is a composite measure of the absence of tariff and non-tariff barriers that affect imports and exports of goods and services. The trade freedom score is based on two inputs: the trade-weighted average tariff rate and non-tariff barriers (NTBs).
Investment Freedom Ranking - In an economically free country, there would be no constraints on the flow of investment capital. Individuals and firms would be allowed to move their resources into and out of specific activities, both internally and across the country’s borders, without restriction.
Financial Freedom Ranking is a measure of banking efficiency as well as a measure of independence from government control and interference in the financial sector. State ownership of banks and other financial institutions such as insurers and capital markets reduce competition and generally lowers the level of available services. The Index scores an economy’s financial freedom by looking into the following five broad areas: the extent of government regulation of financial services; the degree of state intervention in banks and other financial firms through direct and indirect ownership; the extent of financial and capital market development; government influence on the allocation of credit; and openness to foreign competition.
APPENDIX B
Logistics Performance Index (LPI) 2021
Logistics Performance Index overall score reflects perceptions of a country's logistics based on six core components (referred to as pillars in this report): quality of trade- and transport-related infrastructure, ease of arranging competitively-priced shipments, quality of logistics services, ability to track and trace consignments, and frequency with which shipments reach the consignee within the scheduled time. The index ranges from 1 to 5, with a higher score representing better performance.
Efficiency of Customs and Border Clearance evaluates efficiency of customs clearance processes (ie speed, simplicity and predictability of formalities).
Quality of Trade and Transport Infrastructure evaluates the quality of trade- and transport-related infrastructure (eg ports, railroads, roads, information technology).
Ease of Arranging International Shipments represents the ease of arranging competitively-priced shipments to markets.
Quality of Logistics Services evaluates the overall level of competence and quality of logistics services (eg transport operators, customs brokers).
Tracking and Tracing Consignments evaluates the ability to track and trace consignments when shipping to the market.
Timeliness of International Shipments represents how often the shipments to assessed markets reach the consignee within the scheduled or expected delivery time.
APPENDIX C
Network Readiness Index (NRI) 2021
Network Readiness Ranking (NRR) is obtained from the Network Readiness Index (NRI). A high ranking reflects a high score in the index. The Network Readiness Index (NRI) provides a methodological framework that identifies the factors enabling national economies to fully benefit from information and communication technology (ICT) advances while highlighting the joint responsibility of all social actors, namely individuals, businesses and governments. The index is split into four main pillars:
Technology Pillar Ranking seeks to assess the level of technology that is a sine qua non for a country’s participation in the global economy. It consists of three sub-pillars: Access, Content and Future Technologies.
People Pillar Ranking seeks to assess the availability and level of technology in a country and if its population and organisations have the access, resources, and skills to use it productively. This pillar is therefore concerned with the application of ICT by people at three levels of analysis: individuals, businesses and governments.
Governance Pillar Ranking measures levels of trust, regulation and inclusion between market participants. Trust analyses how safe individuals and firms are in the context of the network economy. This does not only relate to actual crime and security, but also to perceptions of safety and privacy. Regulation measures the extent to which the government promotes participation in the network economy through regulation. Inclusion refers to digital divides within countries where governance can address issues such as inequality based on gender, disabilities and socioeconomic status.
Impact Pillar Ranking seeks to assess the economic, social and human impact of participation in the network economy. It consists of Economy, Quality of Life and Sustainable Development Goals (SDG) Contribution sub-pillars.